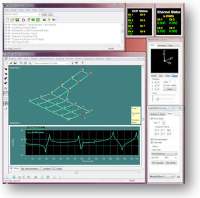
Noise Source Identification Software
CATSAcoustics/STARAcoustics graphs data in 2 or 3 dimensions to help you identify the position of noise sources. Contour maps handle both uniform and non-uniform test grids that match the geometry of a planar test surface. 3D vector displays allow you to examine the characteristics of sound fields, particularly around non-uniform structures. The vectors offer insight into noise source locations, strength of intensity, and propagation direction.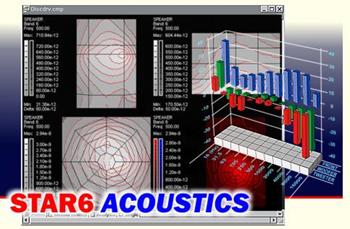
Visit the Spectral Dynamics (UK) Ltd website for more information on Noise Source Identification Software
ENQUIRY FORM